
Why can't the R² of your standard curve reach 0.99?
In ELISA experiments, the coefficient of determination (R²) of the standard curve is a core indicator for measuring the reliability of detection results and the stability of linear relationships, directly affecting the accuracy of target quantification— the closer R² is to 1, the better the linear correlation between standard concentration and detection signal, the higher the credibility of experimental data, and the easier it is to pass strict requirements such as paper review and clinical validation.
However, in actual experiments, many researchers and laboratory technicians encounter the same problem: despite repeated debugging, the standard curve R² never reaches 0.99, or even hovers below 0.95, rendering experimental data unusable and detection results lose reference value. In fact, this is not all due to kit issues. According to industry experience statistics, 90% of standard curve R² failures originate from the details control throughout the entire experimental process.
Faced with the dilemma of substandard standard curve R², there is no need to blindly replace kits or repeat experiments. Identifying the root cause first can lead to efficient solutions. Below, we break down the key links that are easily overlooked but directly affect R² throughout the ELISA experimental process, helping you avoid pitfalls and easily obtain qualified data.
I. Reagent Factors: Improper Source Quality Control
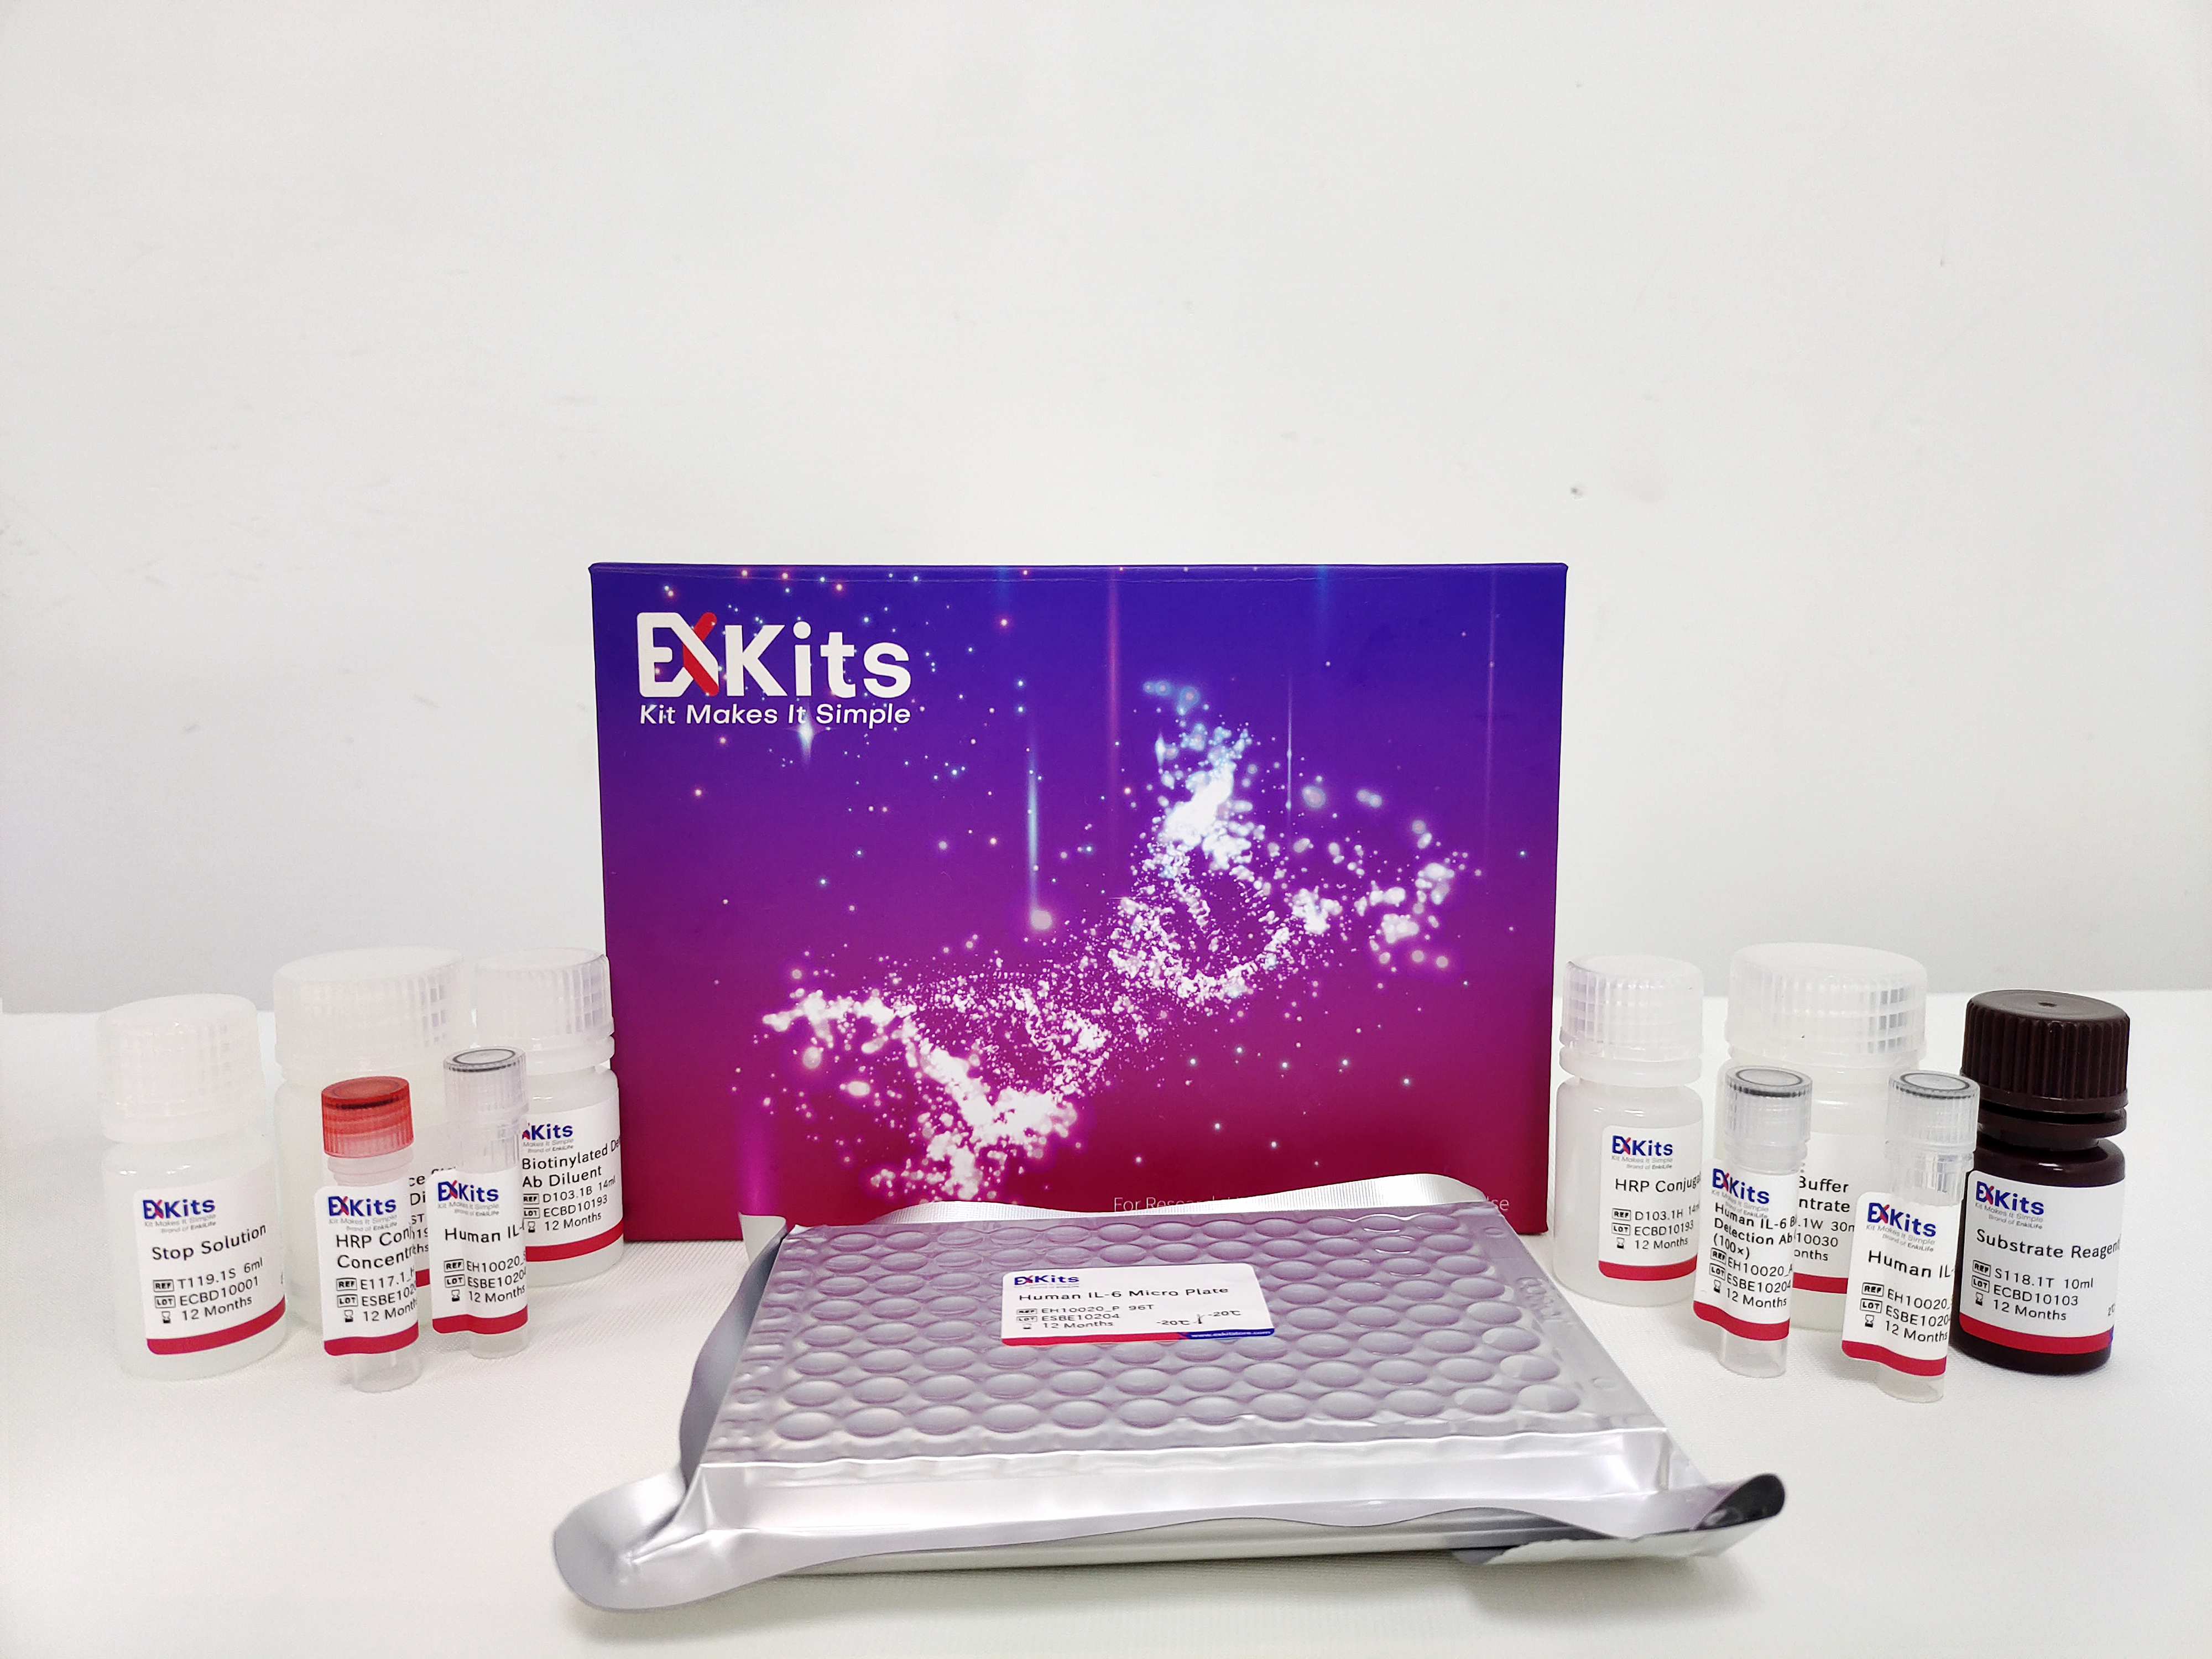
1. Improper Storage and Handling of Standards
• Inappropriate storage conditions: Failure to strictly follow the temperature requirements specified in the kit instructions leads to protein denaturation of standards and degradation of small molecule targets, resulting in significant deviations between actual and theoretical concentrations of prepared standards. Especially for high-concentration standards, OD values will show a significant decrease, disrupting the linear relationship of the standard curve.
• Repeated freeze-thaw and expiration: Repeated freeze-thawing of standards causes protein conformational changes and loss of activity; using expired standards reduces effective component content, also causing concentration inaccuracies and abnormal signals at various concentration points of the standard curve.
• Aliquoting and evaporation issues: Excessively small aliquot volumes of standards are prone to evaporation during storage or thawing, leading to higher actual concentrations at high-concentration points, disrupting the linear correlation with other concentration points, resulting in discrete points and reduced R² values.
2. Deterioration or Inactivation of Key Reagents
• Heterogeneous coating antigen/antibody: During the coating process, uneven antigen/antibody concentration or improper control of coating temperature or time leads to significant differences in binding amounts of the same concentration standard in different microplate wells, increasing OD value dispersion and deteriorating linear fitting results.
• Enzyme conjugate inactivation: Failure to store enzyme conjugates in the dark, precipitation, or excessive standing time after dilution leads to decreased enzyme activity, inability to effectively amplify antigen-antibody binding signals, especially in high-concentration wells, resulting in insufficient color development, low OD values, and abnormal standard curve slopes.
• Abnormal chromogenic and stop solutions: Chromogenic solutions not stored in the dark or showing turbidity and precipitation lead to unstable chromogenic reactions; stop solution concentration deviations or delayed measurement after addition cause incomplete termination reactions, resulting in abnormally high OD values in low-concentration wells and disrupting standard curve linearity.
II. Operational Factors: Non-Standard Experimental Procedures
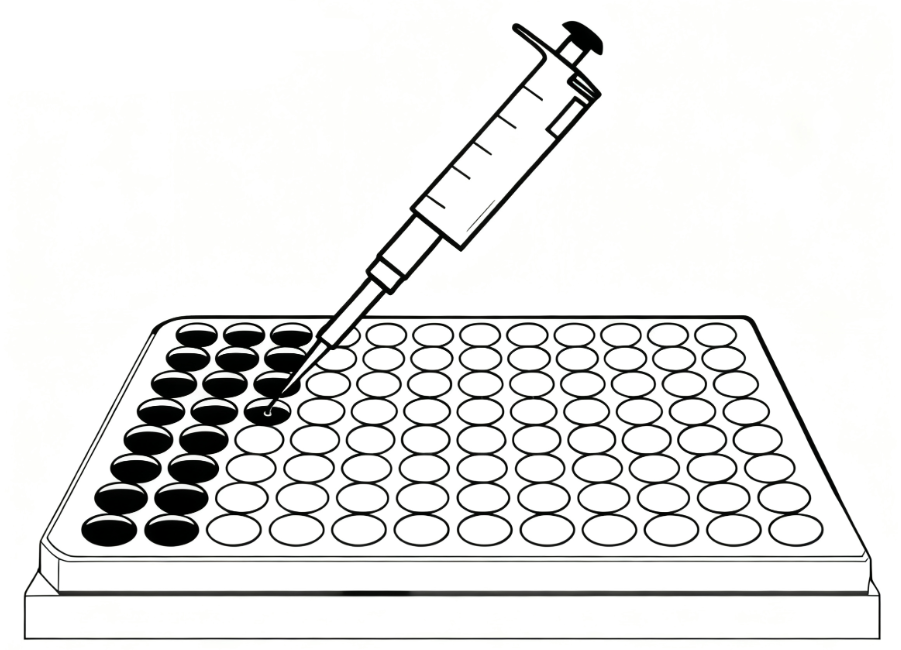
1. Incomplete Dissolution and Mixing of Standards
When dissolving standard powders, failure to add the corresponding volume of diluent as per instructions or insufficient mixing after dissolution leads to uneven distribution of actual target content in the same concentration standard solution. After sample addition, target concentrations vary between different wells, increasing OD value dispersion, and standard curve linearity naturally fails to meet requirements.
2. Non-Standard Serial Dilution Operations
Serial dilution is the core step in preparing standard curve gradient concentrations; improper operation directly disrupts standard curve linearity. Common issues include:
• Inaccurate pipetting: Insufficient pipette aspiration/dispensing or protein adsorption on pipette tip inner walls leads to pipetting volume deviations, preventing gradient concentrations from reaching theoretical values.
• Bubble interference: Excessive speed during vortex mixing or generation of numerous bubbles during aspiration/dispensing causes bubbles to occupy pipetting volume, resulting in insufficient actual pipetting volume. Simultaneously, bubbles adhering to microplate well walls affect antigen-antibody binding, further increasing OD value differences.
• Sample addition errors: Wrong wells, missed wells, or chaotic sample addition sequences during sample addition lead to missing concentration points or mismatches between concentrations and well positions, directly disrupting the linear relationship of the standard curve and causing significant drops in R² values.
3. Improper Reagent Dilution and Plate Washing
In addition to standard dilution, improper dilution ratios of key reagents such as enzyme conjugates and chromogenic solutions, if not strictly following kit instructions, lead to excessively strong or weak detection signals, deviating from the linear detection range and causing standard curve fitting failure. Furthermore, excessive plate washing leads to over-elution of enzyme bound in high-concentration wells, resulting in low OD values. Inadequate plate washing causes non-specific binding, leading to high OD values in low-concentration wells. Both situations disrupt standard curve linearity, preventing R² from meeting requirements.
III. Incubation Factors: Poor Control of Sample Addition and Incubation Conditions
1. Excessively Long Sample Addition Time
During sample addition, if the time for adding samples to a single plate is too long, the incubation time gap between earlier and later added wells is too large, leading to inconsistent antigen-antibody binding degrees, causing the standard curve slope to change from steep to flat and disrupting the linear relationship.
2. Deviations in Incubation Temperature and Time
Incubation temperature fluctuations exceeding ±1°C, or excessively long or short incubation times, affect antigen-antibody binding efficiency— high temperature and long time increase non-specific binding; low temperature and short time result in insufficient binding. Both situations increase OD value dispersion, raise CV values, and decrease R².
3. Edge Effect Interference
During incubation, liquid in edge wells of microplates is prone to evaporation, leading to abnormally high OD values in edge wells, increasing differences from central wells, resulting in obvious discrete points in the standard curve and lowering R² values.
IV. Detection and Calculation Factors: End-Stage Errors
1. Improper Control of Chromogenic Time
The chromogenic reaction time must strictly follow instructions and cannot be arbitrarily extended or shortened. Excessively long chromogenic time depletes the substrate, causing OD values in high-concentration wells to plateau, while OD values in low-concentration wells continue to increase. Excessively short chromogenic time results in low OD values in low-concentration wells with weak signals. Both situations disrupt the linear relationship of the standard curve, leading to decreased R².
2. Inconsistent Termination Reactions
Significant differences in stop solution addition speed or failure to mix immediately after addition lead to inconsistent termination reaction degrees for the same concentration standard— some wells terminate completely with stable OD values, while others terminate incompletely with ongoing chromogenic reactions, ultimately increasing OD value dispersion and affecting standard curve fitting.
3. Microplate Reader Measurement Errors
During microplate reader measurement, selecting the wrong measurement wavelength or failing to remove outliers before measurement directly lowers the linear fitting degree of the standard curve, resulting in decreased R².
Good Data=50%High-Quality Kit+50%Standardized Operation